Arizona Car Accident Statistics — Complete Crash Data 2015–2022
Arizona’s roads are becoming more dangerous every year. Between 2015 and 2022, the state recorded 7,652 fatal crashes and 8,402 traffic fatalities — a 48% increase in deadly crashes over just eight years. Law Badgers built a crash data pipeline from NHTSA federal records, Phoenix Police Department incident data, and ADOT sources to produce the most comprehensive Arizona crash analysis available. This page presents that data in full.
Arizona Fatal Crash Statistics: The Complete Picture
Statewide Fatalities Are Rising Sharply
Arizona recorded 1,200 fatal crashes in 2022 — the single worst year in our dataset, and 48% higher than the 811 recorded in 2015. Fatalities track even worse: 1,320 people died in traffic crashes in Arizona in 2022, compared to 897 in 2015, a 47% increase.
| Year | Fatal Crashes | Fatalities | Change from Prior Year |
|---|---|---|---|
| 2015 | 811 | 897 | — |
| 2016 | 856 | 952 | +5.6% |
| 2017 | 917 | 998 | +7.1% |
| 2018 | 918 | 1,011 | +0.1% |
| 2019 | 908 | 979 | -1.1% |
| 2020 | 966 | 1,053 | +6.4% |
| 2021 | 1,076 | 1,192 | +11.4% |
| 2022 | 1,200 | 1,320 | +11.5% |
The COVID-19 years are particularly telling. Despite reduced driving miles in 2020, fatal crashes increased — a pattern consistent with higher-speed driving on emptier roads. The post-COVID years locked in that elevated fatality rate and worsened it further. Arizona’s population grew roughly 12% from 2015 to 2022; traffic deaths grew four times faster.
Arizona’s Deadliest Highways
Interstate 10 Is the Most Dangerous Road in the State
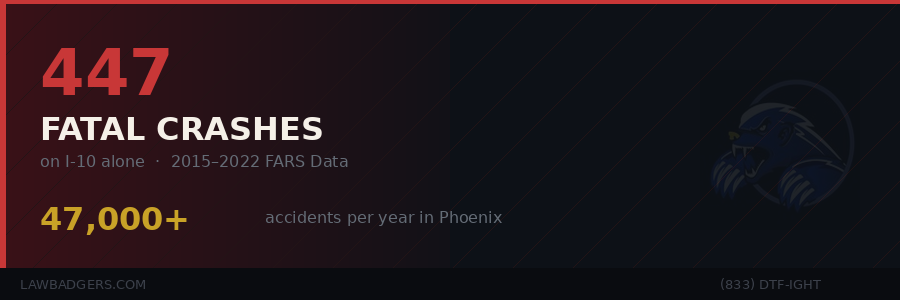
Of all roads in Arizona, Interstate 10 is the deadliest by a significant margin. NHTSA FARS data from 2015 to 2022 shows 447 fatal crashes on I-10, resulting in 527 deaths — nearly double the next most dangerous highway. Sixty-six of those crashes (15%) involved alcohol.
The Phoenix-to-Tucson corridor on I-10 concentrates the greatest danger. High speeds (75+ mph posted, higher in practice), heavy commercial truck traffic connecting Los Angeles ports to the rest of the country, heat-related tire blowouts, drowsy driving on long desert stretches, and Arizona’s documented wrong-way driver problem all converge on this highway.
Arizona Highway Rankings by Fatal Crashes (2015–2022)
| Rank | Highway | Fatal Crashes | Fatalities | Alcohol Involved |
|---|---|---|---|---|
| 1 | I-10 (Interstate 10) | 447 | 527 | 66 |
| 2 | US-60 (Superstition Freeway) | 253 | 274 | 42 |
| 3 | I-17 (Interstate 17) | 209 | 236 | 47 |
| 4 | I-40 (Interstate 40) | 204 | 247 | 23 |
| 5 | SR-87 (State Route 87) | 146 | 166 | 10 |
| 6 | SR-347 (John Wayne Pkwy) | 35 | 43 | 7 |
| 7 | SR-51 (Piestewa Freeway) | 18 | 20 | 4 |
| 8 | SR-143 (Hohokam Expressway) | 3 | 4 | 1 |
I-17 between Phoenix and Flagstaff is Arizona’s third deadliest highway, with crashes concentrated on the grades near Black Canyon City and Sunset Point and at the high-conflict merge zones approaching the I-10/I-17 Stack interchange in central Phoenix.
SR-87 (also known as the Beeline Highway, and in its southern portion Country Club Drive through Mesa and Chandler) recorded 146 fatal crashes — the fifth-most dangerous highway in the state and a significant hazard for drivers traveling between Phoenix and the White Mountains or Payson.
Arizona County-by-County Fatal Crash Data
Maricopa County Accounts for Half of All Arizona Traffic Deaths
Maricopa County recorded 3,801 fatal crashes and 4,054 deaths from 2015 to 2022 — 49.7% of all fatal crashes statewide, despite being home to roughly 60% of Arizona’s population. Fatal crashes in Maricopa rose 50% from 371 in 2015 to 557 in 2022.
| County | Fatal Crashes | Fatalities | Alcohol Involved | AZ Share |
|---|---|---|---|---|
| Maricopa | 3,801 | 4,054 | 613 | 49.7% |
| Pima | 1,018 | 1,083 | 173 | 13.3% |
| Pinal | 469 | 543 | 78 | 6.1% |
| Mohave | 379 | 438 | 62 | 5.0% |
| Yavapai | 369 | 419 | 50 | 4.8% |
| Coconino | 344 | 400 | 53 | 4.5% |
| Navajo | 275 | 334 | 46 | 3.6% |
| Apache | 228 | 266 | 46 | 3.0% |
| Yuma | 190 | 201 | 30 | 2.5% |
| Cochise | 172 | 195 | 33 | 2.2% |
| Gila | 166 | 193 | 20 | 2.2% |
| La Paz | 115 | 134 | 11 | 1.5% |
| Graham | 60 | 71 | 12 | 0.8% |
| Santa Cruz | 46 | 51 | 5 | 0.6% |
| Greenlee | 10 | 10 | 3 | 0.1% |
Pima County (Tucson) is second with 1,018 fatal crashes. Pinal County, which sits between the two metros and carries significant I-10 and US-60 traffic, recorded 469 fatal crashes — making it the third deadliest county despite a population roughly one-fifth the size of Maricopa’s.
Phoenix’s Most Dangerous Streets and Intersections
Indian School Road: Arizona’s Deadliest Surface Street
Indian School Road recorded 84 fatal crashes between 2015 and 2022 — more than any other non-freeway road in Arizona. That averages more than 10 traffic fatalities per year on a single street. The deadliest section runs from 19th Avenue west to 83rd Avenue, where the road functions as a high-speed arterial through dense residential and commercial development with limited pedestrian infrastructure.
The West Phoenix Grid: Arizona’s Most Dangerous Square Miles
When Phoenix’s deadliest surface streets are mapped, they converge in a corridor between 43rd and 83rd Avenues, bounded roughly by McDowell Road to the south and Bell Road to the north. The data makes the case clearly:
- Indian School Road — 84 fatal crashes (deadliest surface street in Arizona)
- McDowell Road — 63 fatal crashes
- 19th Avenue — 56 fatal crashes
- 43rd Avenue — 55 fatal crashes
- Broadway Road — 53 fatal crashes
- 35th Avenue — 49 fatal crashes
- Van Buren Street — 47 fatal crashes
- Thomas Road — 45 fatal crashes
- Camelback Road — 42 fatal crashes
- 51st Avenue — 38 fatal crashes
Phoenix’s grid design — wide, multi-lane arterials spaced every mile, with long signal cycles and speed limits of 40–45 mph that drivers routinely exceed — creates highway-like conditions on roads that pedestrians and cyclists must cross. Pedestrian fatalities concentrate on exactly these corridors. West Phoenix’s higher rates of foot traffic combined with thinner sidewalk infrastructure make the danger worse.
Phoenix Accident Volume: Total Incidents by Road (2018–2025)
Beyond fatal crashes, Phoenix Police Department dispatch data covering 379,090 traffic incidents from 2018 to 2025 reveals the full volume picture. Indian School Road leads with 23,393 total incidents, nearly one-fifth of which occur during the 3–6 PM rush hour window alone:
| Road | Total Incidents | PM Rush | AM Rush | Night |
|---|---|---|---|---|
| Indian School Rd | 23,393 | 4,151 | 1,585 | 1,354 |
| Thomas Rd | 19,593 | 3,511 | 1,300 | 1,113 |
| McDowell Rd | 19,016 | 3,495 | 1,336 | 1,281 |
| Camelback Rd | 14,604 | 2,610 | 923 | 819 |
| Bell Rd | 14,480 | 2,540 | 907 | 742 |
| 7th Ave | 13,174 | 1,807 | 942 | 689 |
| 7th St | 10,521 | 2,079 | 854 | 470 |
| Baseline Rd | 10,346 | 1,915 | 734 | 504 |
| Van Buren St | 8,721 | 1,496 | 715 | 631 |
| Bethany Home Rd | 7,563 | 1,423 | 547 | 361 |
The PM rush hour (3–6 PM) consistently produces the highest crash volumes across every road in the dataset. Friday is the most dangerous day of the week — the combination of commuter volume and end-of-week fatigue and alcohol consumption is measurable in the data.
Explore the Data: Interactive Crash Tool
Law Badgers built this crash data explorer from the raw NHTSA FARS records and Phoenix Police incident data. Use it to examine statewide trends, compare highways and counties, search specific intersections, and view fatal crash hotspots on a live map.
Arizona Crash Data Explorer
Charts, highway rankings, county breakdowns, 100+ Phoenix intersection stats, and a fatal crash hotspot map — all interactive.
Launch the Dashboard →Phoenix’s Most Dangerous Intersections
Our analysis of 500 Phoenix intersections ranked by total incident volume identifies a clear concentration in West Phoenix. The ten highest-volume intersections all fall within the West Phoenix grid described above:
| Rank | Intersection | Total Incidents | Injury/Fatal | Injury Rate |
|---|---|---|---|---|
| 1 | S 99th Ave & W Lower Buckeye Rd | 947 | 88 | 9.3% |
| 2 | N 67th Ave & W Indian School Rd | 910 | 189 | 20.8% |
| 3 | N 51st Ave & W Indian School Rd | 840 | 162 | 19.3% |
| 4 | N 67th Ave & W McDowell Rd | 829 | 171 | 20.6% |
| 5 | N 43rd Ave & W McDowell Rd | 787 | 143 | 18.2% |
| 6 | N 43rd Ave & W Indian School Rd | 736 | 155 | 21.1% |
| 7 | N 43rd Ave & W Thomas Rd | 734 | 145 | 19.8% |
| 8 | N 51st Ave & W McDowell Rd | 708 | 155 | 21.9% |
| 9 | N 27th Ave & W Camelback Rd | 668 | 138 | 20.7% |
| 10 | N 35th Ave & W Bethany Home Rd | 655 | 120 | 18.3% |
The injury-to-total ratio at these intersections — consistently 18–22% — is the number that matters for injury claims. More than one in five incidents at these intersections involves an injury or fatality. The data is drawn from Phoenix Police Department dispatch records and covers incidents from 2018 to 2025.
Why This Data Matters for Your Case
Crash data does more than satisfy curiosity. In personal injury litigation, it establishes the foreseeability of a dangerous condition — a foundational element in negligence claims.
When a client is injured at N 67th Ave and W Indian School Rd, we can show that intersection has produced 189 injury and fatal incidents in eight years. When someone is hurt on a stretch of Indian School Road, we can show the road has killed 84 people. When a crash happens on I-10, we can document that it’s the deadliest highway in Arizona with 527 fatalities from 2015 to 2022.
This data establishes that:
- The danger was known. These are not flukes. They are documented, recurring patterns visible in federal records.
- The risk was foreseeable. A reasonably careful driver — or a government entity responsible for road design — should have accounted for these conditions.
- Your injuries fit a documented pattern. Juries and adjusters respond to context. Data is context.
Law Badgers built this analysis because no other Phoenix personal injury firm has done so. We use it in every case we take involving these roads, these intersections, and these patterns.
Frequently Asked Questions About Arizona Crash Statistics
How many fatal car accidents happen in Arizona each year?
Arizona averaged 957 fatal crashes per year from 2015 to 2022. The number has risen sharply — from 811 in 2015 to 1,200 in 2022, a 48% increase. In 2022, those crashes killed 1,320 people. The trend is consistently upward, with no year-over-year declines after 2019.
What is the most dangerous highway in Arizona?
Interstate 10 is Arizona’s most dangerous highway by total fatal crashes. Between 2015 and 2022, I-10 recorded 447 fatal crashes and 527 fatalities — more than any other road in the state. US Route 60 (253) and Interstate 17 (209) rank second and third. See our full I-10 accident analysis and I-17 crash data for detailed breakdowns.
What is the most dangerous road in Phoenix?
Indian School Road is the deadliest non-freeway road in Phoenix, with 84 fatal crashes from 2015 to 2022. The highest-danger section runs from roughly 19th Avenue to 83rd Avenue. For the full analysis of Phoenix’s deadliest streets, see our West Phoenix deadly corridor report.
Which county in Arizona has the most traffic deaths?
Maricopa County (Phoenix metro) has the most traffic deaths by a substantial margin — 4,054 fatalities from 2015 to 2022, accounting for 48% of all Arizona traffic deaths. Pima County (Tucson) is a distant second at 1,083. See our Maricopa County fatal crash statistics for a year-by-year breakdown.
Are Arizona car accident fatalities increasing?
Yes, significantly. Fatal crashes increased 48% from 2015 to 2022, and fatalities rose 47% over the same period. Arizona’s population grew only about 12% during that time, meaning the per-capita fatality rate is rising sharply. 2021 and 2022 were the two worst years in the dataset.
When do most car accidents happen in Phoenix?
The 3–6 PM window is the highest-volume accident period across all Phoenix roads. Friday is consistently the most dangerous day. Late-night weekend hours (10 PM–2 AM) produce a secondary spike in severe crashes and fatalities, driven by impaired driving. Morning rush hour (7–9 AM) is a significant secondary volume period but produces fewer fatalities per incident than night crashes.
What should I do after a car accident on an Arizona highway?
Move to safety if possible — secondary crashes on high-speed roads are a real hazard. Call 911. Document the scene with photos and video before any vehicles are moved. Get names and contact information from all witnesses. Seek medical evaluation immediately, even if you feel uninjured — symptoms of serious injuries including traumatic brain injuries can be delayed. Call an attorney before speaking with any insurance company. See our complete Arizona car accident checklist.
Does crash data help in a personal injury lawsuit?
Yes. Crash history data establishes that a dangerous condition was known and foreseeable — both to the at-fault driver and, in some cases, to government entities responsible for road design. We use intersection-level crash data in negotiations with insurers and at trial to demonstrate that our client’s injury was not a freak accident but a predictable outcome of a documented hazard.
Data Sources and Methodology
The crash data on this page comes from three primary sources:
NHTSA Fatality Analysis Reporting System (FARS): The federal government’s official record of all fatal crashes on public roads in the United States. FARS data is collected from police crash reports, vital statistics records, and state vehicle registration files. Our dataset covers 2015–2022 for Arizona.
Phoenix Police Department Calls-for-Service Data: Dispatch records covering traffic incidents from 2018–2025, geocoded by intersection. This source captures the full incident volume — including non-fatal injury and property-damage crashes — not just fatalities. Total records: 379,090.
Law Badgers Crash Data Pipeline: We built a proprietary processing pipeline that geocodes FARS records by road and intersection, normalizes road name variants, filters by county, and aggregates by time period and road segment. The hotspot analysis uses a spatial clustering algorithm to identify grid cells with multiple fatal crashes.
Alcohol involvement data was unavailable for 2021 and 2022 in the statewide FARS dataset. Surface-street fatal crash counts are drawn from the complete FARS pull, not the geocoded subset (which is missing approximately 188 records due to absent coordinates in the source data).
Law Badgers PLLC represents injured people in Phoenix, Maricopa County, and throughout Arizona. We handle car accidents, truck accidents, motorcycle crashes, pedestrian accidents, wrongful death, and related personal injury claims. All consultations are free. We charge no fee unless we win. Call (833) DTF-IGHT or contact us online.
INJURED? GET A FREE CONSULTATION.
The Law Badgers fight for maximum compensation. No fee unless we win.
Call (833) DTF-IGHT